Divida a matriz ao longo do eixo especificado. Python
importnumpyasnpa=np.array([[1357911][24681012]])# horizontal splittingprint('Splitting along horizontal axis into 2 parts:n'np.hsplit(a2))# vertical splittingprint('nSplitting along vertical axis into 2 parts:n'np.vsplit(a2))
O termo transmissão descreve como o NumPy trata arrays com formatos diferentes durante operações aritméticas. Sujeito a certas restrições, o array menor é 'transmitido' pelo array maior para que tenham formatos compatíveis. A transmissão fornece um meio de vetorizar operações de array para que o loop ocorra em C em vez de Python. Isso é feito sem fazer cópias desnecessárias de dados e geralmente leva a implementações eficientes de algoritmos. Há também casos em que a transmissão é uma má ideia porque leva ao uso ineficiente da memória, o que retarda a computação. As operações NumPy geralmente são feitas elemento por elemento, o que requer que duas matrizes tenham exatamente o mesmo formato. A regra de transmissão do Numpy relaxa essa restrição quando as formas dos arrays atendem a certas restrições. A regra de transmissão: Para transmitir, o tamanho dos eixos finais de ambas as matrizes em uma operação deve ser do mesmo tamanho ou um deles deve ser um . Let us see some examples:
A(2-D array): 4 x 3 B(1-D array): 3 Result : 4 x 3
A(4-D array): 7 x 1 x 6 x 1 B(3-D array): 3 x 1 x 5 Result : 7 x 3 x 6 x 5
But this would be a mismatch:
A: 4 x 3 B: 4
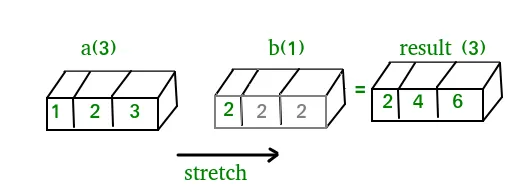
The simplest broadcasting example occurs when an array and a scalar value are combined in an operation. Consider the example given below: Python
importnumpyasnpa=np.array([1.02.03.0])# Example 1b=2.0print(a*b)# Example 2c=[2.02.02.0]print(a*c)
Output:
[ 2. 4. 6.] [ 2. 4. 6.]
We can think of the scalar b being stretched during the arithmetic operation into an array with the same shape as a. The new elements in b as shown in above figure are simply copies of the original scalar. Although the stretching analogy is only conceptual. Numpy is smart enough to use the original scalar value without actually making copies so that broadcasting operations are as memory and computationally efficient as possible. Because Example 1 moves less memory (b is a scalar not an array) around during the multiplication it is about 10% faster than Example 2 using the standard numpy on Windows 2000 with one million element arrays! The figure below makes the concept more clear: In above example the scalar b is stretched to become an array of with the same shape as a so the shapes are compatible for element-by-element multiplication. Now let us see an example where both arrays get stretched. Python
Em alguns casos, a transmissão estende ambas as matrizes para formar uma matriz de saída maior do que qualquer uma das matrizes iniciais.
Trabalhando com data e hora:
Numpy has core array data types which natively support datetime functionality. The data type is called datetime64 so named because datetime is already taken by the datetime library included in Python. Consider the example below for some examples: Python
importnumpyasnp# creating a datetoday=np.datetime64('2017-02-12')print('Date is:'today)print('Year is:'np.datetime64(today'Y'))# creating array of dates in a monthdates=np.arange('2017-02''2017-03'dtype='datetime64[D]')print('nDates of February 2017:n'dates)print('Today is February:'todayindates)# arithmetic operation on datesdur=np.datetime64('2017-05-22')-np.datetime64('2016-05-22')print('nNo. of days:'dur)print('No. of weeks:'np.timedelta64(dur'W'))# sorting datesa=np.array(['2017-02-12''2016-10-13''2019-05-22']dtype='datetime64')print('nDates in sorted order:'np.sort(a))
Output:
Date is: 2017-02-12 Year is: 2017 Dates of February 2017: ['2017-02-01' '2017-02-02' '2017-02-03' '2017-02-04' '2017-02-05' '2017-02-06' '2017-02-07' '2017-02-08' '2017-02-09' '2017-02-10' '2017-02-11' '2017-02-12' '2017-02-13' '2017-02-14' '2017-02-15' '2017-02-16' '2017-02-17' '2017-02-18' '2017-02-19' '2017-02-20' '2017-02-21' '2017-02-22' '2017-02-23' '2017-02-24' '2017-02-25' '2017-02-26' '2017-02-27' '2017-02-28'] Today is February: True No. of days: 365 days No. of weeks: 52 weeks Dates in sorted order: ['2016-10-13' '2017-02-12' '2019-05-22']
Álgebra linear em NumPy:
O módulo de Álgebra Linear do NumPy oferece vários métodos para aplicar álgebra linear em qualquer matriz numpy. Você pode encontrar:
rastreamento determinante de classificação, etc. de uma matriz.
próprios valores ou matrizes
produtos de matrizes e vetores (ponto interno externo etc. produto) exponenciação de matrizes
resolva equações lineares ou tensoriais e muito mais!
Consider the example below which explains how we can use NumPy to do some matrix operations. Python
importnumpyasnpA=np.array([[611][4-25][287]])print('Rank of A:'np.linalg.matrix_rank(A))print('nTrace of A:'np.trace(A))print('nDeterminant of A:'np.linalg.det(A))print('nInverse of A:n'np.linalg.inv(A))print('nMatrix A raised to power 3:n'np.linalg.matrix_power(A3))
Output:
Rank of A: 3 Trace of A: 11 Determinant of A: -306.0 Inverse of A: [[ 0.17647059 -0.00326797 -0.02287582] [ 0.05882353 -0.13071895 0.08496732] [-0.11764706 0.1503268 0.05228758]] Matrix A raised to power 3: [[336 162 228] [406 162 469] [698 702 905]]
Let us assume that we want to solve this linear equation set:
x + 2*y = 8 3*x + 4*y = 18
This problem can be solved using linalg.solve method as shown in example below: Python
importnumpyasnp# coefficientsa=np.array([[12][34]])# constantsb=np.array([818])print('Solution of linear equations:'np.linalg.solve(ab))
Output:
Solution of linear equations: [ 2. 3.]
Finally we see an example which shows how one can perform linear regression using least squares method. A linear regression line is of the form w1 x + w 2 = y e é a linha que minimiza a soma dos quadrados da distância de cada ponto de dados à linha. Portanto, dados n pares de dados (xi yi), os parâmetros que procuramos são w1 e w2 que minimizam o erro: Let us have a look at the example below: Python
importnumpyasnpimportmatplotlib.pyplotasplt# x co-ordinatesx=np.arange(09)A=np.array([xnp.ones(9)])# linearly generated sequencey=[192020.521.522232325.524]# obtaining the parameters of regression linew=np.linalg.lstsq(A.Ty)[0]# plotting the lineline=w[0]*x+w[1]# regression lineplt.plot(xline'r-')plt.plot(xy'o')plt.show()
Output: Portanto, isso leva à conclusão desta série de tutoriais do NumPy. NumPy é uma biblioteca de uso geral amplamente usada que está no centro de muitas outras bibliotecas de computação, como scipy scikit-learn tensorflow matplotlib opencv etc. Ter um conhecimento básico de NumPy ajuda a lidar com outras bibliotecas de nível superior de forma eficiente! Referências:
 In above example the scalar b is stretched to become an array of with the same shape as a so the shapes are compatible for element-by-element multiplication. Now let us see an example where both arrays get stretched. Python
 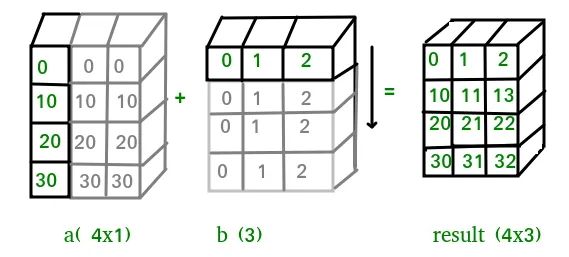 Em alguns casos, a transmissão estende ambas as matrizes para formar uma matriz de saída maior do que qualquer uma das matrizes iniciais.
 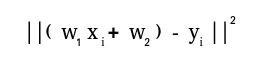 Let us have a look at the example below: Python
 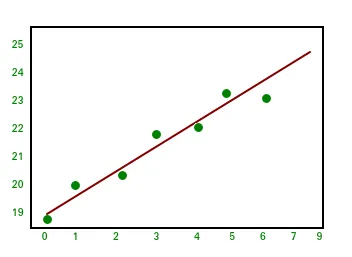 Portanto, isso leva à conclusão desta série de tutoriais do NumPy. NumPy é uma biblioteca de uso geral amplamente usada que está no centro de muitas outras bibliotecas de computação, como scipy scikit-learn tensorflow matplotlib opencv etc. Ter um conhecimento básico de NumPy ajuda a lidar com outras bibliotecas de nível superior de forma eficiente! Referências: