O aleatório é um módulo presente na biblioteca NumPy. Este módulo contém as funções que são usadas para gerar números aleatórios. Este módulo contém alguns métodos simples de geração de dados aleatórios, algumas funções de permutação e distribuição e funções de gerador aleatório.
Todas as funções em um módulo aleatório são as seguintes:
Dados aleatórios simples
Existem as seguintes funções de dados aleatórios simples:
1) p.random.rand(d0, d1, ..., dn)
Esta função do módulo aleatório é usada para gerar números ou valores aleatórios em uma determinada forma.
Exemplo:
import numpy as np a=np.random.rand(5,2) a
Saída:
array([[0.74710182, 0.13306399], [0.01463718, 0.47618842], [0.98980426, 0.48390004], [0.58661785, 0.62895758], [0.38432729, 0.90384119]])
2) np.random.randn(d0, d1, ..., dn)
Esta função do módulo aleatório retorna uma amostra da distribuição 'normal padrão'.
Exemplo:
import numpy as np a=np.random.randn(2,2) a
Saída:
array([[ 1.43327469, -0.02019121], [ 1.54626422, 1.05831067]]) b=np.random.randn() b -0.3080190768904835
3) np.random.randint(baixo[, alto, tamanho, dtype])
Esta função do módulo aleatório é usada para gerar inteiros aleatórios de inclusivo (baixo) a exclusivo (alto).
Exemplo:
import numpy as np a=np.random.randint(3, size=10) a
Saída:
array([1, 1, 1, 2, 0, 0, 0, 0, 0, 0])
4) np.random.random_integers(baixo[, alto, tamanho])
Esta função do módulo aleatório é usada para gerar números inteiros aleatórios do tipo np.int entre baixo e alto.
Exemplo:
import numpy as np a=np.random.random_integers(3) a b=type(np.random.random_integers(3)) b c=np.random.random_integers(5, size=(3,2)) c
Saída:
2 array([[1, 1], [2, 5], [1, 3]])
5) np.random.random_sample([tamanho])
Esta função do módulo aleatório é usada para gerar números flutuantes aleatórios no intervalo semiaberto [0,0, 1,0).
Exemplo:
import numpy as np a=np.random.random_sample() a b=type(np.random.random_sample()) b c=np.random.random_sample((5,)) c
Saída:
0.09250360565571492 array([0.34665418, 0.47027209, 0.75944969, 0.37991244, 0.14159746])
6) np.random.random([tamanho])
Esta função do módulo aleatório é usada para gerar números flutuantes aleatórios no intervalo semiaberto [0,0, 1,0).
Exemplo:
import numpy as np a=np.random.random() a b=type(np.random.random()) b c=np.random.random((5,)) c
Saída:
0.008786953974334155 array([0.05530122, 0.59133394, 0.17258794, 0.6912388 , 0.33412534])
7) np.random.ranf([tamanho])
Esta função do módulo aleatório é usada para gerar números flutuantes aleatórios no intervalo semiaberto [0,0, 1,0).
Exemplo:
import numpy as np a=np.random.ranf() a b=type(np.random.ranf()) b c=np.random.ranf((5,)) c
Saída:
0.2907792098474542 array([0.34084881, 0.07268237, 0.38161256, 0.46494681, 0.88071377])
8) np.random.sample([tamanho])
Esta função do módulo aleatório é usada para gerar números flutuantes aleatórios no intervalo semiaberto [0,0, 1,0).
Exemplo:
import numpy as np a=np.random.sample() a b=type(np.random.sample()) b c=np.random.sample((5,)) c
Saída:
0.012298209913766511 array([0.71878544, 0.11486169, 0.38189074, 0.14303308, 0.07217287])
9) np.random.choice(a[, tamanho, substituir, p])
Esta função do módulo aleatório é usada para gerar uma amostra aleatória de um determinado array 1-D.
Exemplo:
import numpy as np a=np.random.choice(5,3) a b=np.random.choice(5,3, p=[0.2, 0.1, 0.4, 0.2, 0.1]) b
Saída:
array([0, 3, 4]) array([2, 2, 2], dtype=int64)
10) np.random.bytes (comprimento)
string.compare com c#
Esta função do módulo aleatório é usada para gerar bytes aleatórios.
Exemplo:
import numpy as np a=np.random.bytes(7) a
Saída:
'nQx08x83xf9xdex8a'
Permutações
Existem as seguintes funções de permutações:
1)np.random.shuffle()
Esta função é usada para modificar uma sequência no local, embaralhando seu conteúdo.
Exemplo:
import numpy as np a=np.arange(12) a np.random.shuffle(a) a
Saída:
array([ 0, 1, 2, 3, 4, 5, 6, 7, 8, 9, 10, 11]) array([10, 3, 2, 4, 5, 8, 0, 9, 1, 11, 7, 6])
2) np.random.permutation()
Esta função permuta uma sequência aleatoriamente ou retorna um intervalo permutado.
Exemplo:
import numpy as np a=np.random.permutation(12) a
Saída:
array([ 8, 7, 3, 11, 6, 0, 9, 10, 2, 5, 4, 1])
Distribuições
Existem as seguintes funções de permutações:
1) beta(a, b[, tamanho])
Esta função é usada para extrair amostras de uma distribuição Beta.
Exemplo:
def setup(self): self.dist = dist.beta self.cargs = [] self.ckwd = dict(alpha=2, beta=3) self.np_rand_fxn = numpy.random.beta self.np_args = [2, 3] self.np_kwds = dict()
2) binomial(n, p[, tamanho])
Esta função é usada para extrair amostra de uma distribuição binomial.
Exemplo:
import numpy as np n, p = 10, .6 s1= np.random.binomial(n, p, 10) s1
Saída:
array([6, 7, 7, 9, 3, 7, 8, 6, 6, 4])
3) quiquadrado(df[, tamanho])
Esta função é usada para extrair amostra de uma distribuição binomial.
Exemplo:
import numpy as np np.random.chisquare(2,4) sum(np.random.binomial(9, 0.1, 20000) == 0)/20000.
Saída:
array([6, 7, 7, 9, 3, 7, 8, 6, 6, 4])
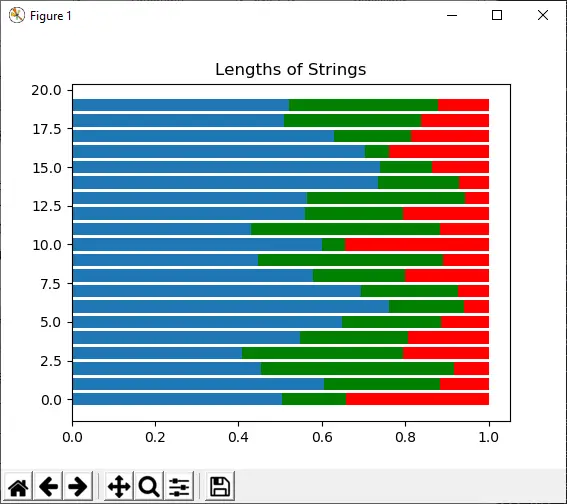
4) dirichlet(alfa[, tamanho])
Esta função é usada para extrair uma amostra da distribuição de Dirichlet.
Exemplo:
Import numpy as np import matplotlib.pyplot as plt s1 = np.random.dirichlet((10, 5, 3), 20).transpose() plt.barh(range(20), s1[0]) plt.barh(range(20), s1[1], left=s1[0], color='g') plt.barh(range(20), s1[2], left=s1[0]+s1[1], color='r') plt.title('Lengths of Strings') plt.show()
Saída:
5) exponencial([escala, tamanho])
Esta função é usada para extrair amostra de uma distribuição exponencial.
Exemplo:
def __init__(self, sourceid, targetid): self.__type = 'Transaction' self.id = uuid4() self.source = sourceid self.target = targetid self.date = self._datetime.date(start=2015, end=2019) self.time = self._datetime.time() if random() <0.05: self.amount="self._numbers.between(100000," 1000000) if random() < 0.15: self.currency="self._business.currency_iso_code()" else: pre> <p> <strong>6) f(dfnum, dfden[, size])</strong> </p> <p>This function is used to draw sample from an F distribution.</p> <p> <strong>Example:</strong> </p> <pre> import numpy as np dfno= 1. dfden = 48. s1 = np.random.f(dfno, dfden, 10) np.sort(s1) </pre> <p> <strong>Output:</strong> </p> <pre> array([0.00264041, 0.04725478, 0.07140803, 0.19526217, 0.23979 , 0.24023478, 0.63141254, 0.95316446, 1.40281789, 1.68327507]) </pre> <p> <strong>7) gamma(shape[, scale, size])</strong> </p> <p>This function is used to draw sample from a Gamma distribution </p> <p> <strong>Example:</strong> </p> <pre> import numpy as np shape, scale = 2., 2. s1 = np.random.gamma(shape, scale, 1000) import matplotlib.pyplot as plt import scipy.special as spss count, bins, ignored = plt.hist(s1, 50, density=True) a = bins**(shape-1)*(np.exp(-bins/scale) / (spss.gamma(shape)*scale**shape)) plt.plot(bins, a, linewidth=2, color='r') plt.show() </pre> <img src="//techcodeview.com/img/numpy-tutorial/36/numpy-random-python-2.webp" alt="numpy.random in Python"> <p> <strong>8) geometric(p[, size])</strong> </p> <p>This function is used to draw sample from a geometric distribution. </p> <p> <strong>Example:</strong> </p> <pre> import numpy as np a = np.random.geometric(p=0.35, size=10000) (a == 1).sum() / 1000 </pre> <p> <strong>Output:</strong> </p> <pre> 3. </pre> <p> <strong>9) gumbel([loc, scale, size])</strong> </p> <p>This function is used to draw sample from a Gumble distribution.</p> <p> <strong>Example:</strong> </p> <pre> import numpy as np lov, scale = 0, 0.2 s1 = np.random.gumbel(loc, scale, 1000) import matplotlib.pyplot as plt count, bins, ignored = plt.hist(s1, 30, density=True) plt.plot(bins, (1/beta)*np.exp(-(bins - loc)/beta)* np.exp( -np.exp( -(bins - loc) /beta) ),linewidth=2, color='r') plt.show() </pre> <p> <strong>Output:</strong> </p> <img src="//techcodeview.com/img/numpy-tutorial/36/numpy-random-python-3.webp" alt="numpy.random in Python"> <p> <strong>10) hypergeometric(ngood, nbad, nsample[, size])</strong> </p> <p>This function is used to draw sample from a Hypergeometric distribution. </p> <p> <strong>Example:</strong> </p> <pre> import numpy as np good, bad, samp = 100, 2, 10 s1 = np.random.hypergeometric(good, bad, samp, 1000) plt.hist(s1) plt.show() </pre> <p> <strong>Output:</strong> </p> <pre> (array([ 13., 0., 0., 0., 0., 163., 0., 0., 0., 824.]), array([ 8. , 8.2, 8.4, 8.6, 8.8, 9. , 9.2, 9.4, 9.6, 9.8, 10. ]), <a 10 list of patch objects>) </a></pre> <p><img src="//techcodeview.com/img/numpy-tutorial/36/numpy-random-python-4.webp" alt="numpy.random in Python"></p> <p> <strong>11) laplace([loc, scale, size])</strong> </p> <p>This function is used to draw sample from the Laplace or double exponential distribution with specified location and scale.</p> <p> <strong>Example:</strong> </p> <pre> import numpy as np location, scale = 0., 2. s = np.random.laplace(location, scale, 10) s </pre> <p> <strong>Output:</strong> </p> <pre> array([-2.77127948, -1.46401453, -0.03723516, -1.61223942, 2.29590691, 1.74297722, 1.49438411, 0.30325513, -0.15948891, -4.99669747]) </pre> <p> <strong>12) logistic([loc, scale, size])</strong> </p> <p>This function is used to draw sample from logistic distribution. </p> <p> <strong>Example:</strong> </p> <pre> import numpy as np import matplotlib.pyplot as plt location, scale = 10, 1 s1 = np.random.logistic(location, scale, 10000) count, bins, ignored = plt.hist(s1, bins=50) count bins ignored plt.show() </pre> <p> <strong>Output:</strong> </p> <pre> array([1.000e+00, 1.000e+00, 1.000e+00, 0.000e+00, 1.000e+00, 1.000e+00, 1.000e+00, 5.000e+00, 7.000e+00, 1.100e+01, 1.800e+01, 3.500e+01, 5.300e+01, 6.700e+01, 1.150e+02, 1.780e+02, 2.300e+02, 3.680e+02, 4.910e+02, 6.400e+02, 8.250e+02, 9.100e+02, 9.750e+02, 1.039e+03, 9.280e+02, 8.040e+02, 6.530e+02, 5.240e+02, 3.380e+02, 2.470e+02, 1.650e+02, 1.150e+02, 8.500e+01, 6.400e+01, 3.300e+01, 1.600e+01, 2.400e+01, 1.400e+01, 4.000e+00, 5.000e+00, 2.000e+00, 2.000e+00, 1.000e+00, 1.000e+00, 0.000e+00, 1.000e+00, 0.000e+00, 0.000e+00, 0.000e+00, 1.000e+00]) array([ 0.50643911, 0.91891814, 1.33139717, 1.7438762 , 2.15635523, 2.56883427, 2.9813133 , 3.39379233, 3.80627136, 4.2187504 , 4.63122943, 5.04370846, 5.45618749, 5.86866652, 6.28114556, 6.69362459, 7.10610362, 7.51858265, 7.93106169, 8.34354072, 8.75601975, 9.16849878, 9.58097781, 9.99345685, 10.40593588, 10.81841491, 11.23089394, 11.64337298, 12.05585201, 12.46833104, 12.88081007, 13.2932891 , 13.70576814, 14.11824717, 14.5307262 , 14.94320523, 15.35568427, 15.7681633 , 16.18064233, 16.59312136, 17.00560039, 17.41807943, 17.83055846, 18.24303749, 18.65551652, 19.06799556, 19.48047459, 19.89295362, 20.30543265, 20.71791168, 21.13039072]) <a 50 list of patch objects> </a></pre> <p><img src="//techcodeview.com/img/numpy-tutorial/36/numpy-random-python-5.webp" alt="numpy.random in Python"></p> <p> <strong>13) lognormal([mean, sigma, size])</strong> </p> <p>This function is used to draw sample from a log-normal distribution.</p> <p> <strong>Example:</strong> </p> <pre> import numpy as np mu, sigma = 2., 1. s1 = np.random.lognormal(mu, sigma, 1000) import matplotlib.pyplot as plt count, bins, ignored = plt.hist(s1, 100, density=True, ) a = np.linspace(min(bins), max(bins), 10000) pdf = (np.exp(-(np.log(a) - mu)**2 / (2 * sigma**2))/ (a * sigma * np.sqrt(2 * np.pi))) plt.plot(a, pdf, linewidth=2, color='r') plt.axis('tight') plt.show() </pre> <p> <strong>Output:</strong> </p> <img src="//techcodeview.com/img/numpy-tutorial/36/numpy-random-python-6.webp" alt="numpy.random in Python"> <p> <strong>14) logseries(p[, size])</strong> </p> <p>This function is used to draw sample from a logarithmic distribution. </p> <p> <strong>Example:</strong> </p> <pre> import numpy as np x = .6 s1 = np.random.logseries(x, 10000) count, bins, ignored = plt.hist(s1) def logseries(k, p): return -p**k/(k*log(1-p)) plt.plot(bins, logseries(bins, x)*count.max()/logseries(bins, a).max(), 'r') plt.show() </pre> <p> <strong>Output:</strong> </p> <img src="//techcodeview.com/img/numpy-tutorial/36/numpy-random-python-7.webp" alt="numpy.random in Python"> <p> <strong>15) multinomial(n, pvals[, size])</strong> </p> <p>This function is used to draw sample from a multinomial distribution. </p> <p> <strong>Example:</strong> </p> <pre> import numpy as np np.random.multinomial(20, [1/6.]*6, size=1) </pre> <p> <strong>Output:</strong> </p> <pre> array([[4, 2, 5, 5, 3, 1]]) </pre> <p> <strong>16) multivariate_normal(mean, cov[, size, ...)</strong> </p> <p>This function is used to draw sample from a multivariate normal distribution. </p> <p> <strong>Example:</strong> </p> <pre> import numpy as np mean = (1, 2) coveriance = [[1, 0], [0, 100]] import matplotlib.pyplot as plt a, b = np.random.multivariate_normal(mean, coveriance, 5000).T plt.plot(a, b, 'x') plt.axis('equal'023 030 ) plt.show() </pre> <p> <strong>Output:</strong> </p> <img src="//techcodeview.com/img/numpy-tutorial/36/numpy-random-python-8.webp" alt="numpy.random in Python"> <p> <strong>17) negative_binomial(n, p[, size])</strong> </p> <p>This function is used to draw sample from a negative binomial distribution. </p> <p> <strong>Example:</strong> </p> <pre> import numpy as np s1 = np.random.negative_binomial(1, 0.1, 100000) for i in range(1, 11): probability = sum(s1 <i) 36 100000. print i, 'wells drilled, probability of one success=", probability </pre> <p> <strong>Output:</strong> </p> <pre> 1 wells drilled, probability of one success = 0 2 wells drilled, probability of one success = 0 3 wells drilled, probability of one success = 0 4 wells drilled, probability of one success = 0 5 wells drilled, probability of one success = 0 6 wells drilled, probability of one success = 0 7 wells drilled, probability of one success = 0 8 wells drilled, probability of one success = 0 9 wells drilled, probability of one success = 0 10 wells drilled, probability of one success = 0 </pre> <p > <strong>18) noncentral_chisquare(df, nonc[, size])</strong> </p> <p>This function is used to draw sample from a noncentral chi-square distribution. </p> <p> <strong>Example:</strong> </p> <pre> import numpy as np import matplotlib.pyplot as plt val = plt.hist(np.random.noncentral_chisquare(3, 25, 100000), bins=200, normed=True) plt.show() </pre> <p> <strong>Output:</strong> </p> <img src=" techcodeview.com img numpy-tutorial numpy-random-python-9.webp' alt="numpy.random in Python"> <p> <strong>19) normal([loc, scale, size])</strong> </p> <p>This function is used to draw sample from a normal distribution.</p> <p> <strong>Example:</strong> </p> <pre> import numpy as np import matplotlib.pyplot as plt mu, sigma = 0, 0.2 # mean and standard deviation s1 = np.random.normal(mu, sigma, 1000) abs(mu - np.mean(s1)) <0.01 1 abs(sigma - np.std(s1, ddof="1))" < 0.01 count, bins, ignored="plt.hist(s1," 30, density="True)" plt.plot(bins, (sigma * np.sqrt(2 np.pi)) *np.exp( (bins mu)**2 (2 sigma**2) ), linewidth="2," color="r" ) plt.show() pre> <p> <strong>Output:</strong> </p> <img src="//techcodeview.com/img/numpy-tutorial/36/numpy-random-python-10.webp" alt="numpy.random in Python"> <p> <strong>20) pareto(a[, size])</strong> </p> <p>This function is used to draw samples from a Lomax or Pareto II with specified shape.</p> <p> <strong>Example:</strong> </p> <pre> import numpy as np import matplotlib.pyplot as plt b, m1 = 3., 2. # shape and mode s1 = (np.random.pareto(b, 1000) + 1) * m1 count, bins, _ = plt.hist(s1, 100, density=True) fit = b*m**b / bins**(b+1) plt.plot(bins, max(count)*fit/max(fit), linewidth=2, color='r') plt.show() </pre> <p> <strong>Output:</strong> </p> <img src="//techcodeview.com/img/numpy-tutorial/36/numpy-random-python-11.webp" alt="numpy.random in Python"> <p> <strong>21) power(a[, size])</strong> </p> <p>This function is used to draw samples in [0, 1] from a power distribution with positive exponent a-1.</p> <p> <strong>Example:</strong> </p> <pre> import numpy as np x = 5. # shape samples = 1000 s1 = np.random.power(x, samples) import matplotlib.pyplot as plt count, bins, ignored = plt.hist(s1, bins=30) a = np.linspace(0, 1, 100) b = x*a**(x-1.) density_b = samples*np.diff(bins)[0]*b plt.plot(a, density_b) plt.show() </pre> <p> <strong>Output:</strong> </p> <img src="//techcodeview.com/img/numpy-tutorial/36/numpy-random-python-12.webp" alt="numpy.random in Python"> <p> <strong>22) rayleigh([scale, size])</strong> </p> <p>This function is used to draw sample from a Rayleigh distribution.</p> <p> <strong>Example:</strong> </p> <pre> val = hist(np.random.rayleigh(3, 100000), bins=200, density=True) meanval = 1 modeval = np.sqrt(2 / np.pi) * meanval s1 = np.random.rayleigh(modeval, 1000000) 100.*sum(s1>3)/1000000. </pre> <p> <strong>Output:</strong> </p> <pre> 0.087300000000000003 </pre> <p><img src="//techcodeview.com/img/numpy-tutorial/36/numpy-random-python-13.webp" alt="numpy.random in Python"></p> <p> <strong>23) standard_cauchy([size])</strong> </p> <p>This function is used to draw sample from a standard Cauchy distribution with mode=0.</p> <p> <strong>Example:</strong> </p> <pre> import numpy as np import matplotlib.pyplot as plt s1 = np.random.standard_cauchy(1000000) s1 = s1[(s1>-25) & (s1<25)] # truncate distribution so it plots well plt.hist(s1, bins="100)" plt.show() < pre> <p> <strong>Output:</strong> </p> <img src="//techcodeview.com/img/numpy-tutorial/36/numpy-random-python-14.webp" alt="numpy.random in Python"> <p> <strong>24) standard_exponential([size])</strong> </p> <p>This function is used to draw sample from a standard exponential distribution.</p> <p> <strong>Example:</strong> </p> <pre> import numpy as np n = np.random.standard_exponential((2, 7000)) </pre> <p> <strong>Output:</strong> </p> <pre> array([[0.53857931, 0.181262 , 0.20478701, ..., 3.66232881, 1.83882709, 1.77963295], [0.65163973, 1.40001955, 0.7525986 , ..., 0.76516523, 0.8400617 , 0.88551011]]) </pre> <p> <strong>25) standard_gamma([size])</strong> </p> <p>This function is used to draw sample from a standard Gamma distribution.</p> <p> <strong>Example:</strong> </p> <pre> import numpy as np shape, scale = 2., 1. s1 = np.random.standard_gamma(shape, 1000000) import matplotlib.pyplot as plt import scipy.special as sps count1, bins1, ignored1 = plt.hist(s, 50, density=True) y = bins1**(shape-1) * ((np.exp(-bins1/scale))/ (sps.gamma(shape) * scale**shape)) plt.plot(bins1, y, linewidth=2, color='r') plt.show() </pre> <p> <strong>Output:</strong> </p> <img src="//techcodeview.com/img/numpy-tutorial/36/numpy-random-python-15.webp" alt="numpy.random in Python"> <p> <strong>26) standard_normal([size])</strong> </p> <p>This function is used to draw sample from a standard Normal distribution.</p> <p> <strong>Example:</strong> </p> <pre> import numpy as np import matplotlib.pyplot as plt s1= np.random.standard_normal(8000) s1 q = np.random.standard_normal(size=(3, 4, 2)) q </pre> <p> <strong>Output:</strong> </p> <pre> array([-3.14907597, 0.95366265, -1.20100026, ..., 3.47180222, 0.9608679 , 0.0774319 ]) array([[[ 1.55635461, -1.29541713], [-1.50534663, -0.02829194], [ 1.03949348, -0.26128132], [ 1.51921798, 0.82136178]], [[-0.4011052 , -0.52458858], [-1.31803814, 0.37415379], [-0.67077365, 0.97447018], [-0.20212115, 0.67840888]], [[ 1.86183474, 0.19946562], [-0.07376021, 0.84599701], [-0.84341386, 0.32081667], [-3.32016062, -1.19029818]]]) </pre> <p> <strong>27) standard_t(df[, size])</strong> </p> <p>This function is used to draw sample from a standard Student's distribution with df degree of freedom.</p> <p> <strong>Example:</strong> </p> <pre> intake = np.array([5260., 5470, 5640, 6180, 6390, 6515, 6805, 7515,8230,8770]) s1 = np.random.standard_t(10, size=100000) np.mean(intake) intake.std(ddof=1) t = (np.mean(intake)-7725)/(intake.std(ddof=1)/np.sqrt(len(intake))) h = plt.hist(s1, bins=100, density=True) np.sum(s1<t) float(len(s1)) plt.show() < pre> <p> <strong>Output:</strong> </p> <pre> 6677.5 1174.1101831694598 0.00864 </pre> <p><img src="//techcodeview.com/img/numpy-tutorial/36/numpy-random-python-16.webp" alt="numpy.random in Python"></p> <p> <strong>28) triangular(left, mode, right[, size])</strong> </p> <p>This function is used to draw sample from a triangular distribution over the interval.</p> <p> <strong>Example:</strong> </p> <pre> import numpy as np import matplotlib.pyplot as plt h = plt.hist(np.random.triangular(-4, 0, 8, 1000000), bins=300,density=True) plt.show() </pre> <p> <strong>Output:</strong> </p> <img src="//techcodeview.com/img/numpy-tutorial/36/numpy-random-python-17.webp" alt="numpy.random in Python"> <p> <strong>29) uniform([low, high, size])</strong> </p> <p>This function is used to draw sample from a uniform distribution.</p> <p> <strong>Example:</strong> </p> <pre> import numpy as np import matplotlib.pyplot as plt s1 = np.random.uniform(-1,0,1000) np.all(s1 >= -1) np.all(s1 <0) count, bins, ignored="plt.hist(s1," 15, density="True)" plt.plot(bins, np.ones_like(bins), linewidth="2," color="r" ) plt.show() < pre> <p> <strong>Output:</strong> </p> <img src="//techcodeview.com/img/numpy-tutorial/36/numpy-random-python-18.webp" alt="numpy.random in Python"> <p> <strong>30) vonmises(m1, m2[, size])</strong> </p> <p>This function is used to draw sample from a von Mises distribution.</p> <p> <strong>Example:</strong> </p> <pre> import numpy as np import matplotlib.pyplot as plt m1, m2 = 0.0, 4.0 s1 = np.random.vonmises(m1, m2, 1000) from scipy.special import i0 plt.hist(s1, 50, density=True) x = np.linspace(-np.pi, np.pi, num=51) y = np.exp(m2*np.cos(x-m1))/(2*np.pi*i0(m2)) plt.plot(x, y, linewidth=2, color='r') plt.show() </pre> <p> <strong>Output:</strong> </p> <img src="//techcodeview.com/img/numpy-tutorial/36/numpy-random-python-19.webp" alt="numpy.random in Python"> <p> <strong>31) wald(mean, scale[, size])</strong> </p> <p>This function is used to draw sample from a Wald, or inverse Gaussian distribution.</p> <p> <strong>Example:</strong> </p> <pre> import numpy as np import matplotlib.pyplot as plt h = plt.hist(np.random.wald(3, 3, 100000), bins=250, density=True) plt.show() </pre> <p> <strong>Output:</strong> </p> <img src="//techcodeview.com/img/numpy-tutorial/36/numpy-random-python-20.webp" alt="numpy.random in Python"> <p> <strong>32) weibull(a[, size])</strong> </p> <p>This function is used to draw sample from a Weibull distribution.</p> <p> <strong>Example:</strong> </p> <pre> import numpy as np import matplotlib.pyplot as plt from scipy import special x=2.0 s=np.random.weibull(x, 1000) a = np.arange(1, 100.)/50. def weib(x, n, a): return (a/n)*(x/n)**np.exp(-(x/n)**a) count, bins, ignored = plt.hist(np.random.weibull(5.,1000)) a= np.arange(1,100.)/50. scale = count.max()/weib(x, 1., 5.).max() scale = count.max()/weib(a, 1., 5.).max() plt.plot(x, weib(x, 1., 5.)*scale) plt.show() </pre> <p> <strong>Output:</strong> </p> <img src="//techcodeview.com/img/numpy-tutorial/36/numpy-random-python-21.webp" alt="numpy.random in Python"> <p> <strong>33) zipf(a[, size])</strong> </p> <p>This function is used to draw sample from a Zipf distribution.</p> <p> <strong>Example:</strong> </p> <pre> import numpy as np import matplotlib.pyplot as plt from scipy import special x=2.0 s=np.random.zipf(x, 1000) count, bins, ignored = plt.hist(s[s<50], 50, density="True)" a="np.arange(1.," 50.) b="a**(-x)" special.zetac(x) plt.plot(a, max(b), linewidth="2," color="r" ) plt.show() < pre> <p> <strong>Output:</strong> </p> <img src="//techcodeview.com/img/numpy-tutorial/36/numpy-random-python-22.webp" alt="numpy.random in Python"> <hr></50],></pre></0)></pre></t)></pre></25)]></pre></0.01></pre></i)></pre></0.05:>
Saída:
array([0.00264041, 0.04725478, 0.07140803, 0.19526217, 0.23979 , 0.24023478, 0.63141254, 0.95316446, 1.40281789, 1.68327507])
7) gama(forma[, escala, tamanho])
Esta função é usada para extrair amostra de uma distribuição gama
Exemplo:
import numpy as np shape, scale = 2., 2. s1 = np.random.gamma(shape, scale, 1000) import matplotlib.pyplot as plt import scipy.special as spss count, bins, ignored = plt.hist(s1, 50, density=True) a = bins**(shape-1)*(np.exp(-bins/scale) / (spss.gamma(shape)*scale**shape)) plt.plot(bins, a, linewidth=2, color='r') plt.show()

8) geométrico(p[, tamanho])
Esta função é usada para extrair amostra de uma distribuição geométrica.
Exemplo:
import numpy as np a = np.random.geometric(p=0.35, size=10000) (a == 1).sum() / 1000
Saída:
função de substring java
3.
9) gumbel([loc, escala, tamanho])
Esta função é usada para extrair amostras de uma distribuição Gumble.
Exemplo:
import numpy as np lov, scale = 0, 0.2 s1 = np.random.gumbel(loc, scale, 1000) import matplotlib.pyplot as plt count, bins, ignored = plt.hist(s1, 30, density=True) plt.plot(bins, (1/beta)*np.exp(-(bins - loc)/beta)* np.exp( -np.exp( -(bins - loc) /beta) ),linewidth=2, color='r') plt.show()
Saída:

10) hipergeométrico (ngood, nbad, nsample[, size])
Esta função é usada para extrair amostra de uma distribuição hipergeométrica.
Exemplo:
import numpy as np good, bad, samp = 100, 2, 10 s1 = np.random.hypergeometric(good, bad, samp, 1000) plt.hist(s1) plt.show()
Saída:
(array([ 13., 0., 0., 0., 0., 163., 0., 0., 0., 824.]), array([ 8. , 8.2, 8.4, 8.6, 8.8, 9. , 9.2, 9.4, 9.6, 9.8, 10. ]), <a 10 list of patch objects>) </a>

11) laplace([loc, escala, tamanho])
Esta função é usada para extrair amostra da distribuição Laplace ou exponencial dupla com localização e escala especificadas.
Exemplo:
import numpy as np location, scale = 0., 2. s = np.random.laplace(location, scale, 10) s
Saída:
array([-2.77127948, -1.46401453, -0.03723516, -1.61223942, 2.29590691, 1.74297722, 1.49438411, 0.30325513, -0.15948891, -4.99669747])
12) logística([loc, escala, tamanho])
Esta função é usada para extrair amostra da distribuição logística.
Exemplo:
import numpy as np import matplotlib.pyplot as plt location, scale = 10, 1 s1 = np.random.logistic(location, scale, 10000) count, bins, ignored = plt.hist(s1, bins=50) count bins ignored plt.show()
Saída:
array([1.000e+00, 1.000e+00, 1.000e+00, 0.000e+00, 1.000e+00, 1.000e+00, 1.000e+00, 5.000e+00, 7.000e+00, 1.100e+01, 1.800e+01, 3.500e+01, 5.300e+01, 6.700e+01, 1.150e+02, 1.780e+02, 2.300e+02, 3.680e+02, 4.910e+02, 6.400e+02, 8.250e+02, 9.100e+02, 9.750e+02, 1.039e+03, 9.280e+02, 8.040e+02, 6.530e+02, 5.240e+02, 3.380e+02, 2.470e+02, 1.650e+02, 1.150e+02, 8.500e+01, 6.400e+01, 3.300e+01, 1.600e+01, 2.400e+01, 1.400e+01, 4.000e+00, 5.000e+00, 2.000e+00, 2.000e+00, 1.000e+00, 1.000e+00, 0.000e+00, 1.000e+00, 0.000e+00, 0.000e+00, 0.000e+00, 1.000e+00]) array([ 0.50643911, 0.91891814, 1.33139717, 1.7438762 , 2.15635523, 2.56883427, 2.9813133 , 3.39379233, 3.80627136, 4.2187504 , 4.63122943, 5.04370846, 5.45618749, 5.86866652, 6.28114556, 6.69362459, 7.10610362, 7.51858265, 7.93106169, 8.34354072, 8.75601975, 9.16849878, 9.58097781, 9.99345685, 10.40593588, 10.81841491, 11.23089394, 11.64337298, 12.05585201, 12.46833104, 12.88081007, 13.2932891 , 13.70576814, 14.11824717, 14.5307262 , 14.94320523, 15.35568427, 15.7681633 , 16.18064233, 16.59312136, 17.00560039, 17.41807943, 17.83055846, 18.24303749, 18.65551652, 19.06799556, 19.48047459, 19.89295362, 20.30543265, 20.71791168, 21.13039072]) <a 50 list of patch objects> </a>

13) lognormal([média, sigma, tamanho])
Esta função é usada para extrair amostra de uma distribuição log-normal.
Exemplo:
import numpy as np mu, sigma = 2., 1. s1 = np.random.lognormal(mu, sigma, 1000) import matplotlib.pyplot as plt count, bins, ignored = plt.hist(s1, 100, density=True, ) a = np.linspace(min(bins), max(bins), 10000) pdf = (np.exp(-(np.log(a) - mu)**2 / (2 * sigma**2))/ (a * sigma * np.sqrt(2 * np.pi))) plt.plot(a, pdf, linewidth=2, color='r') plt.axis('tight') plt.show()
Saída:

14) série de logs (p[, tamanho])
Esta função é usada para extrair amostra de uma distribuição logarítmica.
Exemplo:
import numpy as np x = .6 s1 = np.random.logseries(x, 10000) count, bins, ignored = plt.hist(s1) def logseries(k, p): return -p**k/(k*log(1-p)) plt.plot(bins, logseries(bins, x)*count.max()/logseries(bins, a).max(), 'r') plt.show()
Saída:

15) multinomial (n, pvals[, tamanho])
Esta função é usada para extrair amostra de uma distribuição multinomial.
Exemplo:
import numpy as np np.random.multinomial(20, [1/6.]*6, size=1)
Saída:
array([[4, 2, 5, 5, 3, 1]])
16) multivariate_normal(média, cov[, tamanho, ...)
Esta função é usada para extrair amostra de uma distribuição normal multivariada.
Exemplo:
import numpy as np mean = (1, 2) coveriance = [[1, 0], [0, 100]] import matplotlib.pyplot as plt a, b = np.random.multivariate_normal(mean, coveriance, 5000).T plt.plot(a, b, 'x') plt.axis('equal'023 030 ) plt.show()
Saída:

17) negativo_binomial(n, p[, tamanho])
Esta função é usada para extrair amostra de uma distribuição binomial negativa.
Exemplo:
import numpy as np s1 = np.random.negative_binomial(1, 0.1, 100000) for i in range(1, 11): probability = sum(s1 <i) 36 100000. print i, \'wells drilled, probability of one success=", probability </pre> <p> <strong>Output:</strong> </p> <pre> 1 wells drilled, probability of one success = 0 2 wells drilled, probability of one success = 0 3 wells drilled, probability of one success = 0 4 wells drilled, probability of one success = 0 5 wells drilled, probability of one success = 0 6 wells drilled, probability of one success = 0 7 wells drilled, probability of one success = 0 8 wells drilled, probability of one success = 0 9 wells drilled, probability of one success = 0 10 wells drilled, probability of one success = 0 </pre> <p > <strong>18) noncentral_chisquare(df, nonc[, size])</strong> </p> <p>This function is used to draw sample from a noncentral chi-square distribution. </p> <p> <strong>Example:</strong> </p> <pre> import numpy as np import matplotlib.pyplot as plt val = plt.hist(np.random.noncentral_chisquare(3, 25, 100000), bins=200, normed=True) plt.show() </pre> <p> <strong>Output:</strong> </p> <img src=" techcodeview.com img numpy-tutorial numpy-random-python-9.webp\' alt="numpy.random in Python"> <p> <strong>19) normal([loc, scale, size])</strong> </p> <p>This function is used to draw sample from a normal distribution.</p> <p> <strong>Example:</strong> </p> <pre> import numpy as np import matplotlib.pyplot as plt mu, sigma = 0, 0.2 # mean and standard deviation s1 = np.random.normal(mu, sigma, 1000) abs(mu - np.mean(s1)) <0.01 1 abs(sigma - np.std(s1, ddof="1))" < 0.01 count, bins, ignored="plt.hist(s1," 30, density="True)" plt.plot(bins, (sigma * np.sqrt(2 np.pi)) *np.exp( (bins mu)**2 (2 sigma**2) ), linewidth="2," color="r" ) plt.show() pre> <p> <strong>Output:</strong> </p> <img src="//techcodeview.com/img/numpy-tutorial/36/numpy-random-python-10.webp" alt="numpy.random in Python"> <p> <strong>20) pareto(a[, size])</strong> </p> <p>This function is used to draw samples from a Lomax or Pareto II with specified shape.</p> <p> <strong>Example:</strong> </p> <pre> import numpy as np import matplotlib.pyplot as plt b, m1 = 3., 2. # shape and mode s1 = (np.random.pareto(b, 1000) + 1) * m1 count, bins, _ = plt.hist(s1, 100, density=True) fit = b*m**b / bins**(b+1) plt.plot(bins, max(count)*fit/max(fit), linewidth=2, color='r') plt.show() </pre> <p> <strong>Output:</strong> </p> <img src="//techcodeview.com/img/numpy-tutorial/36/numpy-random-python-11.webp" alt="numpy.random in Python"> <p> <strong>21) power(a[, size])</strong> </p> <p>This function is used to draw samples in [0, 1] from a power distribution with positive exponent a-1.</p> <p> <strong>Example:</strong> </p> <pre> import numpy as np x = 5. # shape samples = 1000 s1 = np.random.power(x, samples) import matplotlib.pyplot as plt count, bins, ignored = plt.hist(s1, bins=30) a = np.linspace(0, 1, 100) b = x*a**(x-1.) density_b = samples*np.diff(bins)[0]*b plt.plot(a, density_b) plt.show() </pre> <p> <strong>Output:</strong> </p> <img src="//techcodeview.com/img/numpy-tutorial/36/numpy-random-python-12.webp" alt="numpy.random in Python"> <p> <strong>22) rayleigh([scale, size])</strong> </p> <p>This function is used to draw sample from a Rayleigh distribution.</p> <p> <strong>Example:</strong> </p> <pre> val = hist(np.random.rayleigh(3, 100000), bins=200, density=True) meanval = 1 modeval = np.sqrt(2 / np.pi) * meanval s1 = np.random.rayleigh(modeval, 1000000) 100.*sum(s1>3)/1000000. </pre> <p> <strong>Output:</strong> </p> <pre> 0.087300000000000003 </pre> <p><img src="//techcodeview.com/img/numpy-tutorial/36/numpy-random-python-13.webp" alt="numpy.random in Python"></p> <p> <strong>23) standard_cauchy([size])</strong> </p> <p>This function is used to draw sample from a standard Cauchy distribution with mode=0.</p> <p> <strong>Example:</strong> </p> <pre> import numpy as np import matplotlib.pyplot as plt s1 = np.random.standard_cauchy(1000000) s1 = s1[(s1>-25) & (s1<25)] # truncate distribution so it plots well plt.hist(s1, bins="100)" plt.show() < pre> <p> <strong>Output:</strong> </p> <img src="//techcodeview.com/img/numpy-tutorial/36/numpy-random-python-14.webp" alt="numpy.random in Python"> <p> <strong>24) standard_exponential([size])</strong> </p> <p>This function is used to draw sample from a standard exponential distribution.</p> <p> <strong>Example:</strong> </p> <pre> import numpy as np n = np.random.standard_exponential((2, 7000)) </pre> <p> <strong>Output:</strong> </p> <pre> array([[0.53857931, 0.181262 , 0.20478701, ..., 3.66232881, 1.83882709, 1.77963295], [0.65163973, 1.40001955, 0.7525986 , ..., 0.76516523, 0.8400617 , 0.88551011]]) </pre> <p> <strong>25) standard_gamma([size])</strong> </p> <p>This function is used to draw sample from a standard Gamma distribution.</p> <p> <strong>Example:</strong> </p> <pre> import numpy as np shape, scale = 2., 1. s1 = np.random.standard_gamma(shape, 1000000) import matplotlib.pyplot as plt import scipy.special as sps count1, bins1, ignored1 = plt.hist(s, 50, density=True) y = bins1**(shape-1) * ((np.exp(-bins1/scale))/ (sps.gamma(shape) * scale**shape)) plt.plot(bins1, y, linewidth=2, color='r') plt.show() </pre> <p> <strong>Output:</strong> </p> <img src="//techcodeview.com/img/numpy-tutorial/36/numpy-random-python-15.webp" alt="numpy.random in Python"> <p> <strong>26) standard_normal([size])</strong> </p> <p>This function is used to draw sample from a standard Normal distribution.</p> <p> <strong>Example:</strong> </p> <pre> import numpy as np import matplotlib.pyplot as plt s1= np.random.standard_normal(8000) s1 q = np.random.standard_normal(size=(3, 4, 2)) q </pre> <p> <strong>Output:</strong> </p> <pre> array([-3.14907597, 0.95366265, -1.20100026, ..., 3.47180222, 0.9608679 , 0.0774319 ]) array([[[ 1.55635461, -1.29541713], [-1.50534663, -0.02829194], [ 1.03949348, -0.26128132], [ 1.51921798, 0.82136178]], [[-0.4011052 , -0.52458858], [-1.31803814, 0.37415379], [-0.67077365, 0.97447018], [-0.20212115, 0.67840888]], [[ 1.86183474, 0.19946562], [-0.07376021, 0.84599701], [-0.84341386, 0.32081667], [-3.32016062, -1.19029818]]]) </pre> <p> <strong>27) standard_t(df[, size])</strong> </p> <p>This function is used to draw sample from a standard Student's distribution with df degree of freedom.</p> <p> <strong>Example:</strong> </p> <pre> intake = np.array([5260., 5470, 5640, 6180, 6390, 6515, 6805, 7515,8230,8770]) s1 = np.random.standard_t(10, size=100000) np.mean(intake) intake.std(ddof=1) t = (np.mean(intake)-7725)/(intake.std(ddof=1)/np.sqrt(len(intake))) h = plt.hist(s1, bins=100, density=True) np.sum(s1<t) float(len(s1)) plt.show() < pre> <p> <strong>Output:</strong> </p> <pre> 6677.5 1174.1101831694598 0.00864 </pre> <p><img src="//techcodeview.com/img/numpy-tutorial/36/numpy-random-python-16.webp" alt="numpy.random in Python"></p> <p> <strong>28) triangular(left, mode, right[, size])</strong> </p> <p>This function is used to draw sample from a triangular distribution over the interval.</p> <p> <strong>Example:</strong> </p> <pre> import numpy as np import matplotlib.pyplot as plt h = plt.hist(np.random.triangular(-4, 0, 8, 1000000), bins=300,density=True) plt.show() </pre> <p> <strong>Output:</strong> </p> <img src="//techcodeview.com/img/numpy-tutorial/36/numpy-random-python-17.webp" alt="numpy.random in Python"> <p> <strong>29) uniform([low, high, size])</strong> </p> <p>This function is used to draw sample from a uniform distribution.</p> <p> <strong>Example:</strong> </p> <pre> import numpy as np import matplotlib.pyplot as plt s1 = np.random.uniform(-1,0,1000) np.all(s1 >= -1) np.all(s1 <0) count, bins, ignored="plt.hist(s1," 15, density="True)" plt.plot(bins, np.ones_like(bins), linewidth="2," color="r" ) plt.show() < pre> <p> <strong>Output:</strong> </p> <img src="//techcodeview.com/img/numpy-tutorial/36/numpy-random-python-18.webp" alt="numpy.random in Python"> <p> <strong>30) vonmises(m1, m2[, size])</strong> </p> <p>This function is used to draw sample from a von Mises distribution.</p> <p> <strong>Example:</strong> </p> <pre> import numpy as np import matplotlib.pyplot as plt m1, m2 = 0.0, 4.0 s1 = np.random.vonmises(m1, m2, 1000) from scipy.special import i0 plt.hist(s1, 50, density=True) x = np.linspace(-np.pi, np.pi, num=51) y = np.exp(m2*np.cos(x-m1))/(2*np.pi*i0(m2)) plt.plot(x, y, linewidth=2, color='r') plt.show() </pre> <p> <strong>Output:</strong> </p> <img src="//techcodeview.com/img/numpy-tutorial/36/numpy-random-python-19.webp" alt="numpy.random in Python"> <p> <strong>31) wald(mean, scale[, size])</strong> </p> <p>This function is used to draw sample from a Wald, or inverse Gaussian distribution.</p> <p> <strong>Example:</strong> </p> <pre> import numpy as np import matplotlib.pyplot as plt h = plt.hist(np.random.wald(3, 3, 100000), bins=250, density=True) plt.show() </pre> <p> <strong>Output:</strong> </p> <img src="//techcodeview.com/img/numpy-tutorial/36/numpy-random-python-20.webp" alt="numpy.random in Python"> <p> <strong>32) weibull(a[, size])</strong> </p> <p>This function is used to draw sample from a Weibull distribution.</p> <p> <strong>Example:</strong> </p> <pre> import numpy as np import matplotlib.pyplot as plt from scipy import special x=2.0 s=np.random.weibull(x, 1000) a = np.arange(1, 100.)/50. def weib(x, n, a): return (a/n)*(x/n)**np.exp(-(x/n)**a) count, bins, ignored = plt.hist(np.random.weibull(5.,1000)) a= np.arange(1,100.)/50. scale = count.max()/weib(x, 1., 5.).max() scale = count.max()/weib(a, 1., 5.).max() plt.plot(x, weib(x, 1., 5.)*scale) plt.show() </pre> <p> <strong>Output:</strong> </p> <img src="//techcodeview.com/img/numpy-tutorial/36/numpy-random-python-21.webp" alt="numpy.random in Python"> <p> <strong>33) zipf(a[, size])</strong> </p> <p>This function is used to draw sample from a Zipf distribution.</p> <p> <strong>Example:</strong> </p> <pre> import numpy as np import matplotlib.pyplot as plt from scipy import special x=2.0 s=np.random.zipf(x, 1000) count, bins, ignored = plt.hist(s[s<50], 50, density="True)" a="np.arange(1.," 50.) b="a**(-x)" special.zetac(x) plt.plot(a, max(b), linewidth="2," color="r" ) plt.show() < pre> <p> <strong>Output:</strong> </p> <img src="//techcodeview.com/img/numpy-tutorial/36/numpy-random-python-22.webp" alt="numpy.random in Python"> <hr></50],></pre></0)></pre></t)></pre></25)]></pre></0.01></pre></i)>
Saída:

21) potência(a[, tamanho])
Esta função é usada para extrair amostras em [0, 1] de uma distribuição de potência com expoente positivo a-1.
Exemplo:
import numpy as np x = 5. # shape samples = 1000 s1 = np.random.power(x, samples) import matplotlib.pyplot as plt count, bins, ignored = plt.hist(s1, bins=30) a = np.linspace(0, 1, 100) b = x*a**(x-1.) density_b = samples*np.diff(bins)[0]*b plt.plot(a, density_b) plt.show()
Saída:

22) rayleigh([escala, tamanho])
Esta função é usada para extrair amostra de uma distribuição Rayleigh.
Exemplo:
val = hist(np.random.rayleigh(3, 100000), bins=200, density=True) meanval = 1 modeval = np.sqrt(2 / np.pi) * meanval s1 = np.random.rayleigh(modeval, 1000000) 100.*sum(s1>3)/1000000.
Saída:
0.087300000000000003

23) standard_cauchy([tamanho])
Esta função é usada para extrair amostra de uma distribuição de Cauchy padrão com moda = 0.
Exemplo:
import numpy as np import matplotlib.pyplot as plt s1 = np.random.standard_cauchy(1000000) s1 = s1[(s1>-25) & (s1<25)] # truncate distribution so it plots well plt.hist(s1, bins="100)" plt.show() < pre> <p> <strong>Output:</strong> </p> <img src="//techcodeview.com/img/numpy-tutorial/36/numpy-random-python-14.webp" alt="numpy.random in Python"> <p> <strong>24) standard_exponential([size])</strong> </p> <p>This function is used to draw sample from a standard exponential distribution.</p> <p> <strong>Example:</strong> </p> <pre> import numpy as np n = np.random.standard_exponential((2, 7000)) </pre> <p> <strong>Output:</strong> </p> <pre> array([[0.53857931, 0.181262 , 0.20478701, ..., 3.66232881, 1.83882709, 1.77963295], [0.65163973, 1.40001955, 0.7525986 , ..., 0.76516523, 0.8400617 , 0.88551011]]) </pre> <p> <strong>25) standard_gamma([size])</strong> </p> <p>This function is used to draw sample from a standard Gamma distribution.</p> <p> <strong>Example:</strong> </p> <pre> import numpy as np shape, scale = 2., 1. s1 = np.random.standard_gamma(shape, 1000000) import matplotlib.pyplot as plt import scipy.special as sps count1, bins1, ignored1 = plt.hist(s, 50, density=True) y = bins1**(shape-1) * ((np.exp(-bins1/scale))/ (sps.gamma(shape) * scale**shape)) plt.plot(bins1, y, linewidth=2, color='r') plt.show() </pre> <p> <strong>Output:</strong> </p> <img src="//techcodeview.com/img/numpy-tutorial/36/numpy-random-python-15.webp" alt="numpy.random in Python"> <p> <strong>26) standard_normal([size])</strong> </p> <p>This function is used to draw sample from a standard Normal distribution.</p> <p> <strong>Example:</strong> </p> <pre> import numpy as np import matplotlib.pyplot as plt s1= np.random.standard_normal(8000) s1 q = np.random.standard_normal(size=(3, 4, 2)) q </pre> <p> <strong>Output:</strong> </p> <pre> array([-3.14907597, 0.95366265, -1.20100026, ..., 3.47180222, 0.9608679 , 0.0774319 ]) array([[[ 1.55635461, -1.29541713], [-1.50534663, -0.02829194], [ 1.03949348, -0.26128132], [ 1.51921798, 0.82136178]], [[-0.4011052 , -0.52458858], [-1.31803814, 0.37415379], [-0.67077365, 0.97447018], [-0.20212115, 0.67840888]], [[ 1.86183474, 0.19946562], [-0.07376021, 0.84599701], [-0.84341386, 0.32081667], [-3.32016062, -1.19029818]]]) </pre> <p> <strong>27) standard_t(df[, size])</strong> </p> <p>This function is used to draw sample from a standard Student's distribution with df degree of freedom.</p> <p> <strong>Example:</strong> </p> <pre> intake = np.array([5260., 5470, 5640, 6180, 6390, 6515, 6805, 7515,8230,8770]) s1 = np.random.standard_t(10, size=100000) np.mean(intake) intake.std(ddof=1) t = (np.mean(intake)-7725)/(intake.std(ddof=1)/np.sqrt(len(intake))) h = plt.hist(s1, bins=100, density=True) np.sum(s1<t) float(len(s1)) plt.show() < pre> <p> <strong>Output:</strong> </p> <pre> 6677.5 1174.1101831694598 0.00864 </pre> <p><img src="//techcodeview.com/img/numpy-tutorial/36/numpy-random-python-16.webp" alt="numpy.random in Python"></p> <p> <strong>28) triangular(left, mode, right[, size])</strong> </p> <p>This function is used to draw sample from a triangular distribution over the interval.</p> <p> <strong>Example:</strong> </p> <pre> import numpy as np import matplotlib.pyplot as plt h = plt.hist(np.random.triangular(-4, 0, 8, 1000000), bins=300,density=True) plt.show() </pre> <p> <strong>Output:</strong> </p> <img src="//techcodeview.com/img/numpy-tutorial/36/numpy-random-python-17.webp" alt="numpy.random in Python"> <p> <strong>29) uniform([low, high, size])</strong> </p> <p>This function is used to draw sample from a uniform distribution.</p> <p> <strong>Example:</strong> </p> <pre> import numpy as np import matplotlib.pyplot as plt s1 = np.random.uniform(-1,0,1000) np.all(s1 >= -1) np.all(s1 <0) count, bins, ignored="plt.hist(s1," 15, density="True)" plt.plot(bins, np.ones_like(bins), linewidth="2," color="r" ) plt.show() < pre> <p> <strong>Output:</strong> </p> <img src="//techcodeview.com/img/numpy-tutorial/36/numpy-random-python-18.webp" alt="numpy.random in Python"> <p> <strong>30) vonmises(m1, m2[, size])</strong> </p> <p>This function is used to draw sample from a von Mises distribution.</p> <p> <strong>Example:</strong> </p> <pre> import numpy as np import matplotlib.pyplot as plt m1, m2 = 0.0, 4.0 s1 = np.random.vonmises(m1, m2, 1000) from scipy.special import i0 plt.hist(s1, 50, density=True) x = np.linspace(-np.pi, np.pi, num=51) y = np.exp(m2*np.cos(x-m1))/(2*np.pi*i0(m2)) plt.plot(x, y, linewidth=2, color='r') plt.show() </pre> <p> <strong>Output:</strong> </p> <img src="//techcodeview.com/img/numpy-tutorial/36/numpy-random-python-19.webp" alt="numpy.random in Python"> <p> <strong>31) wald(mean, scale[, size])</strong> </p> <p>This function is used to draw sample from a Wald, or inverse Gaussian distribution.</p> <p> <strong>Example:</strong> </p> <pre> import numpy as np import matplotlib.pyplot as plt h = plt.hist(np.random.wald(3, 3, 100000), bins=250, density=True) plt.show() </pre> <p> <strong>Output:</strong> </p> <img src="//techcodeview.com/img/numpy-tutorial/36/numpy-random-python-20.webp" alt="numpy.random in Python"> <p> <strong>32) weibull(a[, size])</strong> </p> <p>This function is used to draw sample from a Weibull distribution.</p> <p> <strong>Example:</strong> </p> <pre> import numpy as np import matplotlib.pyplot as plt from scipy import special x=2.0 s=np.random.weibull(x, 1000) a = np.arange(1, 100.)/50. def weib(x, n, a): return (a/n)*(x/n)**np.exp(-(x/n)**a) count, bins, ignored = plt.hist(np.random.weibull(5.,1000)) a= np.arange(1,100.)/50. scale = count.max()/weib(x, 1., 5.).max() scale = count.max()/weib(a, 1., 5.).max() plt.plot(x, weib(x, 1., 5.)*scale) plt.show() </pre> <p> <strong>Output:</strong> </p> <img src="//techcodeview.com/img/numpy-tutorial/36/numpy-random-python-21.webp" alt="numpy.random in Python"> <p> <strong>33) zipf(a[, size])</strong> </p> <p>This function is used to draw sample from a Zipf distribution.</p> <p> <strong>Example:</strong> </p> <pre> import numpy as np import matplotlib.pyplot as plt from scipy import special x=2.0 s=np.random.zipf(x, 1000) count, bins, ignored = plt.hist(s[s<50], 50, density="True)" a="np.arange(1.," 50.) b="a**(-x)" special.zetac(x) plt.plot(a, max(b), linewidth="2," color="r" ) plt.show() < pre> <p> <strong>Output:</strong> </p> <img src="//techcodeview.com/img/numpy-tutorial/36/numpy-random-python-22.webp" alt="numpy.random in Python"> <hr></50],></pre></0)></pre></t)></pre></25)]>
Saída:
array([[0.53857931, 0.181262 , 0.20478701, ..., 3.66232881, 1.83882709, 1.77963295], [0.65163973, 1.40001955, 0.7525986 , ..., 0.76516523, 0.8400617 , 0.88551011]])
25) gama_padrão([tamanho])
Esta função é usada para extrair amostras de uma distribuição gama padrão.
Exemplo:
import numpy as np shape, scale = 2., 1. s1 = np.random.standard_gamma(shape, 1000000) import matplotlib.pyplot as plt import scipy.special as sps count1, bins1, ignored1 = plt.hist(s, 50, density=True) y = bins1**(shape-1) * ((np.exp(-bins1/scale))/ (sps.gamma(shape) * scale**shape)) plt.plot(bins1, y, linewidth=2, color='r') plt.show()
Saída:

26) padrão_normal([tamanho])
Esta função é usada para extrair amostras de uma distribuição normal padrão.
Exemplo:
import numpy as np import matplotlib.pyplot as plt s1= np.random.standard_normal(8000) s1 q = np.random.standard_normal(size=(3, 4, 2)) q
Saída:
array([-3.14907597, 0.95366265, -1.20100026, ..., 3.47180222, 0.9608679 , 0.0774319 ]) array([[[ 1.55635461, -1.29541713], [-1.50534663, -0.02829194], [ 1.03949348, -0.26128132], [ 1.51921798, 0.82136178]], [[-0.4011052 , -0.52458858], [-1.31803814, 0.37415379], [-0.67077365, 0.97447018], [-0.20212115, 0.67840888]], [[ 1.86183474, 0.19946562], [-0.07376021, 0.84599701], [-0.84341386, 0.32081667], [-3.32016062, -1.19029818]]])
27) standard_t(df[, tamanho])
Esta função é usada para extrair uma amostra de uma distribuição de Student padrão com grau de liberdade df.
recursos de java
Exemplo:
intake = np.array([5260., 5470, 5640, 6180, 6390, 6515, 6805, 7515,8230,8770]) s1 = np.random.standard_t(10, size=100000) np.mean(intake) intake.std(ddof=1) t = (np.mean(intake)-7725)/(intake.std(ddof=1)/np.sqrt(len(intake))) h = plt.hist(s1, bins=100, density=True) np.sum(s1<t) float(len(s1)) plt.show() < pre> <p> <strong>Output:</strong> </p> <pre> 6677.5 1174.1101831694598 0.00864 </pre> <p><img src="//techcodeview.com/img/numpy-tutorial/36/numpy-random-python-16.webp" alt="numpy.random in Python"></p> <p> <strong>28) triangular(left, mode, right[, size])</strong> </p> <p>This function is used to draw sample from a triangular distribution over the interval.</p> <p> <strong>Example:</strong> </p> <pre> import numpy as np import matplotlib.pyplot as plt h = plt.hist(np.random.triangular(-4, 0, 8, 1000000), bins=300,density=True) plt.show() </pre> <p> <strong>Output:</strong> </p> <img src="//techcodeview.com/img/numpy-tutorial/36/numpy-random-python-17.webp" alt="numpy.random in Python"> <p> <strong>29) uniform([low, high, size])</strong> </p> <p>This function is used to draw sample from a uniform distribution.</p> <p> <strong>Example:</strong> </p> <pre> import numpy as np import matplotlib.pyplot as plt s1 = np.random.uniform(-1,0,1000) np.all(s1 >= -1) np.all(s1 <0) count, bins, ignored="plt.hist(s1," 15, density="True)" plt.plot(bins, np.ones_like(bins), linewidth="2," color="r" ) plt.show() < pre> <p> <strong>Output:</strong> </p> <img src="//techcodeview.com/img/numpy-tutorial/36/numpy-random-python-18.webp" alt="numpy.random in Python"> <p> <strong>30) vonmises(m1, m2[, size])</strong> </p> <p>This function is used to draw sample from a von Mises distribution.</p> <p> <strong>Example:</strong> </p> <pre> import numpy as np import matplotlib.pyplot as plt m1, m2 = 0.0, 4.0 s1 = np.random.vonmises(m1, m2, 1000) from scipy.special import i0 plt.hist(s1, 50, density=True) x = np.linspace(-np.pi, np.pi, num=51) y = np.exp(m2*np.cos(x-m1))/(2*np.pi*i0(m2)) plt.plot(x, y, linewidth=2, color='r') plt.show() </pre> <p> <strong>Output:</strong> </p> <img src="//techcodeview.com/img/numpy-tutorial/36/numpy-random-python-19.webp" alt="numpy.random in Python"> <p> <strong>31) wald(mean, scale[, size])</strong> </p> <p>This function is used to draw sample from a Wald, or inverse Gaussian distribution.</p> <p> <strong>Example:</strong> </p> <pre> import numpy as np import matplotlib.pyplot as plt h = plt.hist(np.random.wald(3, 3, 100000), bins=250, density=True) plt.show() </pre> <p> <strong>Output:</strong> </p> <img src="//techcodeview.com/img/numpy-tutorial/36/numpy-random-python-20.webp" alt="numpy.random in Python"> <p> <strong>32) weibull(a[, size])</strong> </p> <p>This function is used to draw sample from a Weibull distribution.</p> <p> <strong>Example:</strong> </p> <pre> import numpy as np import matplotlib.pyplot as plt from scipy import special x=2.0 s=np.random.weibull(x, 1000) a = np.arange(1, 100.)/50. def weib(x, n, a): return (a/n)*(x/n)**np.exp(-(x/n)**a) count, bins, ignored = plt.hist(np.random.weibull(5.,1000)) a= np.arange(1,100.)/50. scale = count.max()/weib(x, 1., 5.).max() scale = count.max()/weib(a, 1., 5.).max() plt.plot(x, weib(x, 1., 5.)*scale) plt.show() </pre> <p> <strong>Output:</strong> </p> <img src="//techcodeview.com/img/numpy-tutorial/36/numpy-random-python-21.webp" alt="numpy.random in Python"> <p> <strong>33) zipf(a[, size])</strong> </p> <p>This function is used to draw sample from a Zipf distribution.</p> <p> <strong>Example:</strong> </p> <pre> import numpy as np import matplotlib.pyplot as plt from scipy import special x=2.0 s=np.random.zipf(x, 1000) count, bins, ignored = plt.hist(s[s<50], 50, density="True)" a="np.arange(1.," 50.) b="a**(-x)" special.zetac(x) plt.plot(a, max(b), linewidth="2," color="r" ) plt.show() < pre> <p> <strong>Output:</strong> </p> <img src="//techcodeview.com/img/numpy-tutorial/36/numpy-random-python-22.webp" alt="numpy.random in Python"> <hr></50],></pre></0)></pre></t)>

28) triangular(esquerda, modo, direita[, tamanho])
Esta função é usada para extrair amostra de uma distribuição triangular ao longo do intervalo.
Exemplo:
import numpy as np import matplotlib.pyplot as plt h = plt.hist(np.random.triangular(-4, 0, 8, 1000000), bins=300,density=True) plt.show()
Saída:

29) uniforme([baixo, alto, tamanho])
Esta função é usada para extrair amostra de uma distribuição uniforme.
Exemplo:
import numpy as np import matplotlib.pyplot as plt s1 = np.random.uniform(-1,0,1000) np.all(s1 >= -1) np.all(s1 <0) count, bins, ignored="plt.hist(s1," 15, density="True)" plt.plot(bins, np.ones_like(bins), linewidth="2," color="r" ) plt.show() < pre> <p> <strong>Output:</strong> </p> <img src="//techcodeview.com/img/numpy-tutorial/36/numpy-random-python-18.webp" alt="numpy.random in Python"> <p> <strong>30) vonmises(m1, m2[, size])</strong> </p> <p>This function is used to draw sample from a von Mises distribution.</p> <p> <strong>Example:</strong> </p> <pre> import numpy as np import matplotlib.pyplot as plt m1, m2 = 0.0, 4.0 s1 = np.random.vonmises(m1, m2, 1000) from scipy.special import i0 plt.hist(s1, 50, density=True) x = np.linspace(-np.pi, np.pi, num=51) y = np.exp(m2*np.cos(x-m1))/(2*np.pi*i0(m2)) plt.plot(x, y, linewidth=2, color='r') plt.show() </pre> <p> <strong>Output:</strong> </p> <img src="//techcodeview.com/img/numpy-tutorial/36/numpy-random-python-19.webp" alt="numpy.random in Python"> <p> <strong>31) wald(mean, scale[, size])</strong> </p> <p>This function is used to draw sample from a Wald, or inverse Gaussian distribution.</p> <p> <strong>Example:</strong> </p> <pre> import numpy as np import matplotlib.pyplot as plt h = plt.hist(np.random.wald(3, 3, 100000), bins=250, density=True) plt.show() </pre> <p> <strong>Output:</strong> </p> <img src="//techcodeview.com/img/numpy-tutorial/36/numpy-random-python-20.webp" alt="numpy.random in Python"> <p> <strong>32) weibull(a[, size])</strong> </p> <p>This function is used to draw sample from a Weibull distribution.</p> <p> <strong>Example:</strong> </p> <pre> import numpy as np import matplotlib.pyplot as plt from scipy import special x=2.0 s=np.random.weibull(x, 1000) a = np.arange(1, 100.)/50. def weib(x, n, a): return (a/n)*(x/n)**np.exp(-(x/n)**a) count, bins, ignored = plt.hist(np.random.weibull(5.,1000)) a= np.arange(1,100.)/50. scale = count.max()/weib(x, 1., 5.).max() scale = count.max()/weib(a, 1., 5.).max() plt.plot(x, weib(x, 1., 5.)*scale) plt.show() </pre> <p> <strong>Output:</strong> </p> <img src="//techcodeview.com/img/numpy-tutorial/36/numpy-random-python-21.webp" alt="numpy.random in Python"> <p> <strong>33) zipf(a[, size])</strong> </p> <p>This function is used to draw sample from a Zipf distribution.</p> <p> <strong>Example:</strong> </p> <pre> import numpy as np import matplotlib.pyplot as plt from scipy import special x=2.0 s=np.random.zipf(x, 1000) count, bins, ignored = plt.hist(s[s<50], 50, density="True)" a="np.arange(1.," 50.) b="a**(-x)" special.zetac(x) plt.plot(a, max(b), linewidth="2," color="r" ) plt.show() < pre> <p> <strong>Output:</strong> </p> <img src="//techcodeview.com/img/numpy-tutorial/36/numpy-random-python-22.webp" alt="numpy.random in Python"> <hr></50],></pre></0)>
Saída:

31) wald(média, escala[, tamanho])
Esta função é usada para extrair amostra de uma distribuição Wald ou Gaussiana inversa.
Exemplo:
import numpy as np import matplotlib.pyplot as plt h = plt.hist(np.random.wald(3, 3, 100000), bins=250, density=True) plt.show()
Saída:

32) weibull(a[, tamanho])
Esta função é usada para extrair amostra de uma distribuição Weibull.
Exemplo:
import numpy as np import matplotlib.pyplot as plt from scipy import special x=2.0 s=np.random.weibull(x, 1000) a = np.arange(1, 100.)/50. def weib(x, n, a): return (a/n)*(x/n)**np.exp(-(x/n)**a) count, bins, ignored = plt.hist(np.random.weibull(5.,1000)) a= np.arange(1,100.)/50. scale = count.max()/weib(x, 1., 5.).max() scale = count.max()/weib(a, 1., 5.).max() plt.plot(x, weib(x, 1., 5.)*scale) plt.show()
Saída:

33) zipf(a[, tamanho])
Esta função é usada para extrair amostra de uma distribuição Zipf.
Exemplo:
import numpy as np import matplotlib.pyplot as plt from scipy import special x=2.0 s=np.random.zipf(x, 1000) count, bins, ignored = plt.hist(s[s<50], 50, density="True)" a="np.arange(1.," 50.) b="a**(-x)" special.zetac(x) plt.plot(a, max(b), linewidth="2," color="r" ) plt.show() < pre> <p> <strong>Output:</strong> </p> <img src="//techcodeview.com/img/numpy-tutorial/36/numpy-random-python-22.webp" alt="numpy.random in Python"> <hr></50],>